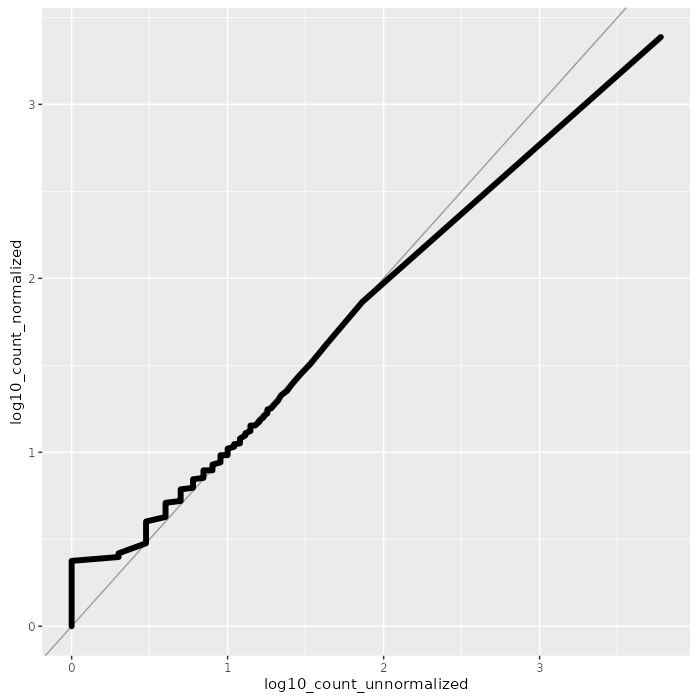
The plot below shows the quantile-quantile relationship of unnormalized to normalized insertion counts, overall and for each sample.
The normalized ATAC-seq dataset contains accessibility profiles for 8 samples.
Signal has been normalized for the following region sets:
| #regions | normalization | |
| tiling | 276356 | quantileNorm |
| promoter | 1216 | quantileNorm |
| consensusPeaks | 6256 | quantileNorm |
The plot below shows the quantile-quantile relationship of unnormalized to normalized insertion counts, overall and for each sample.
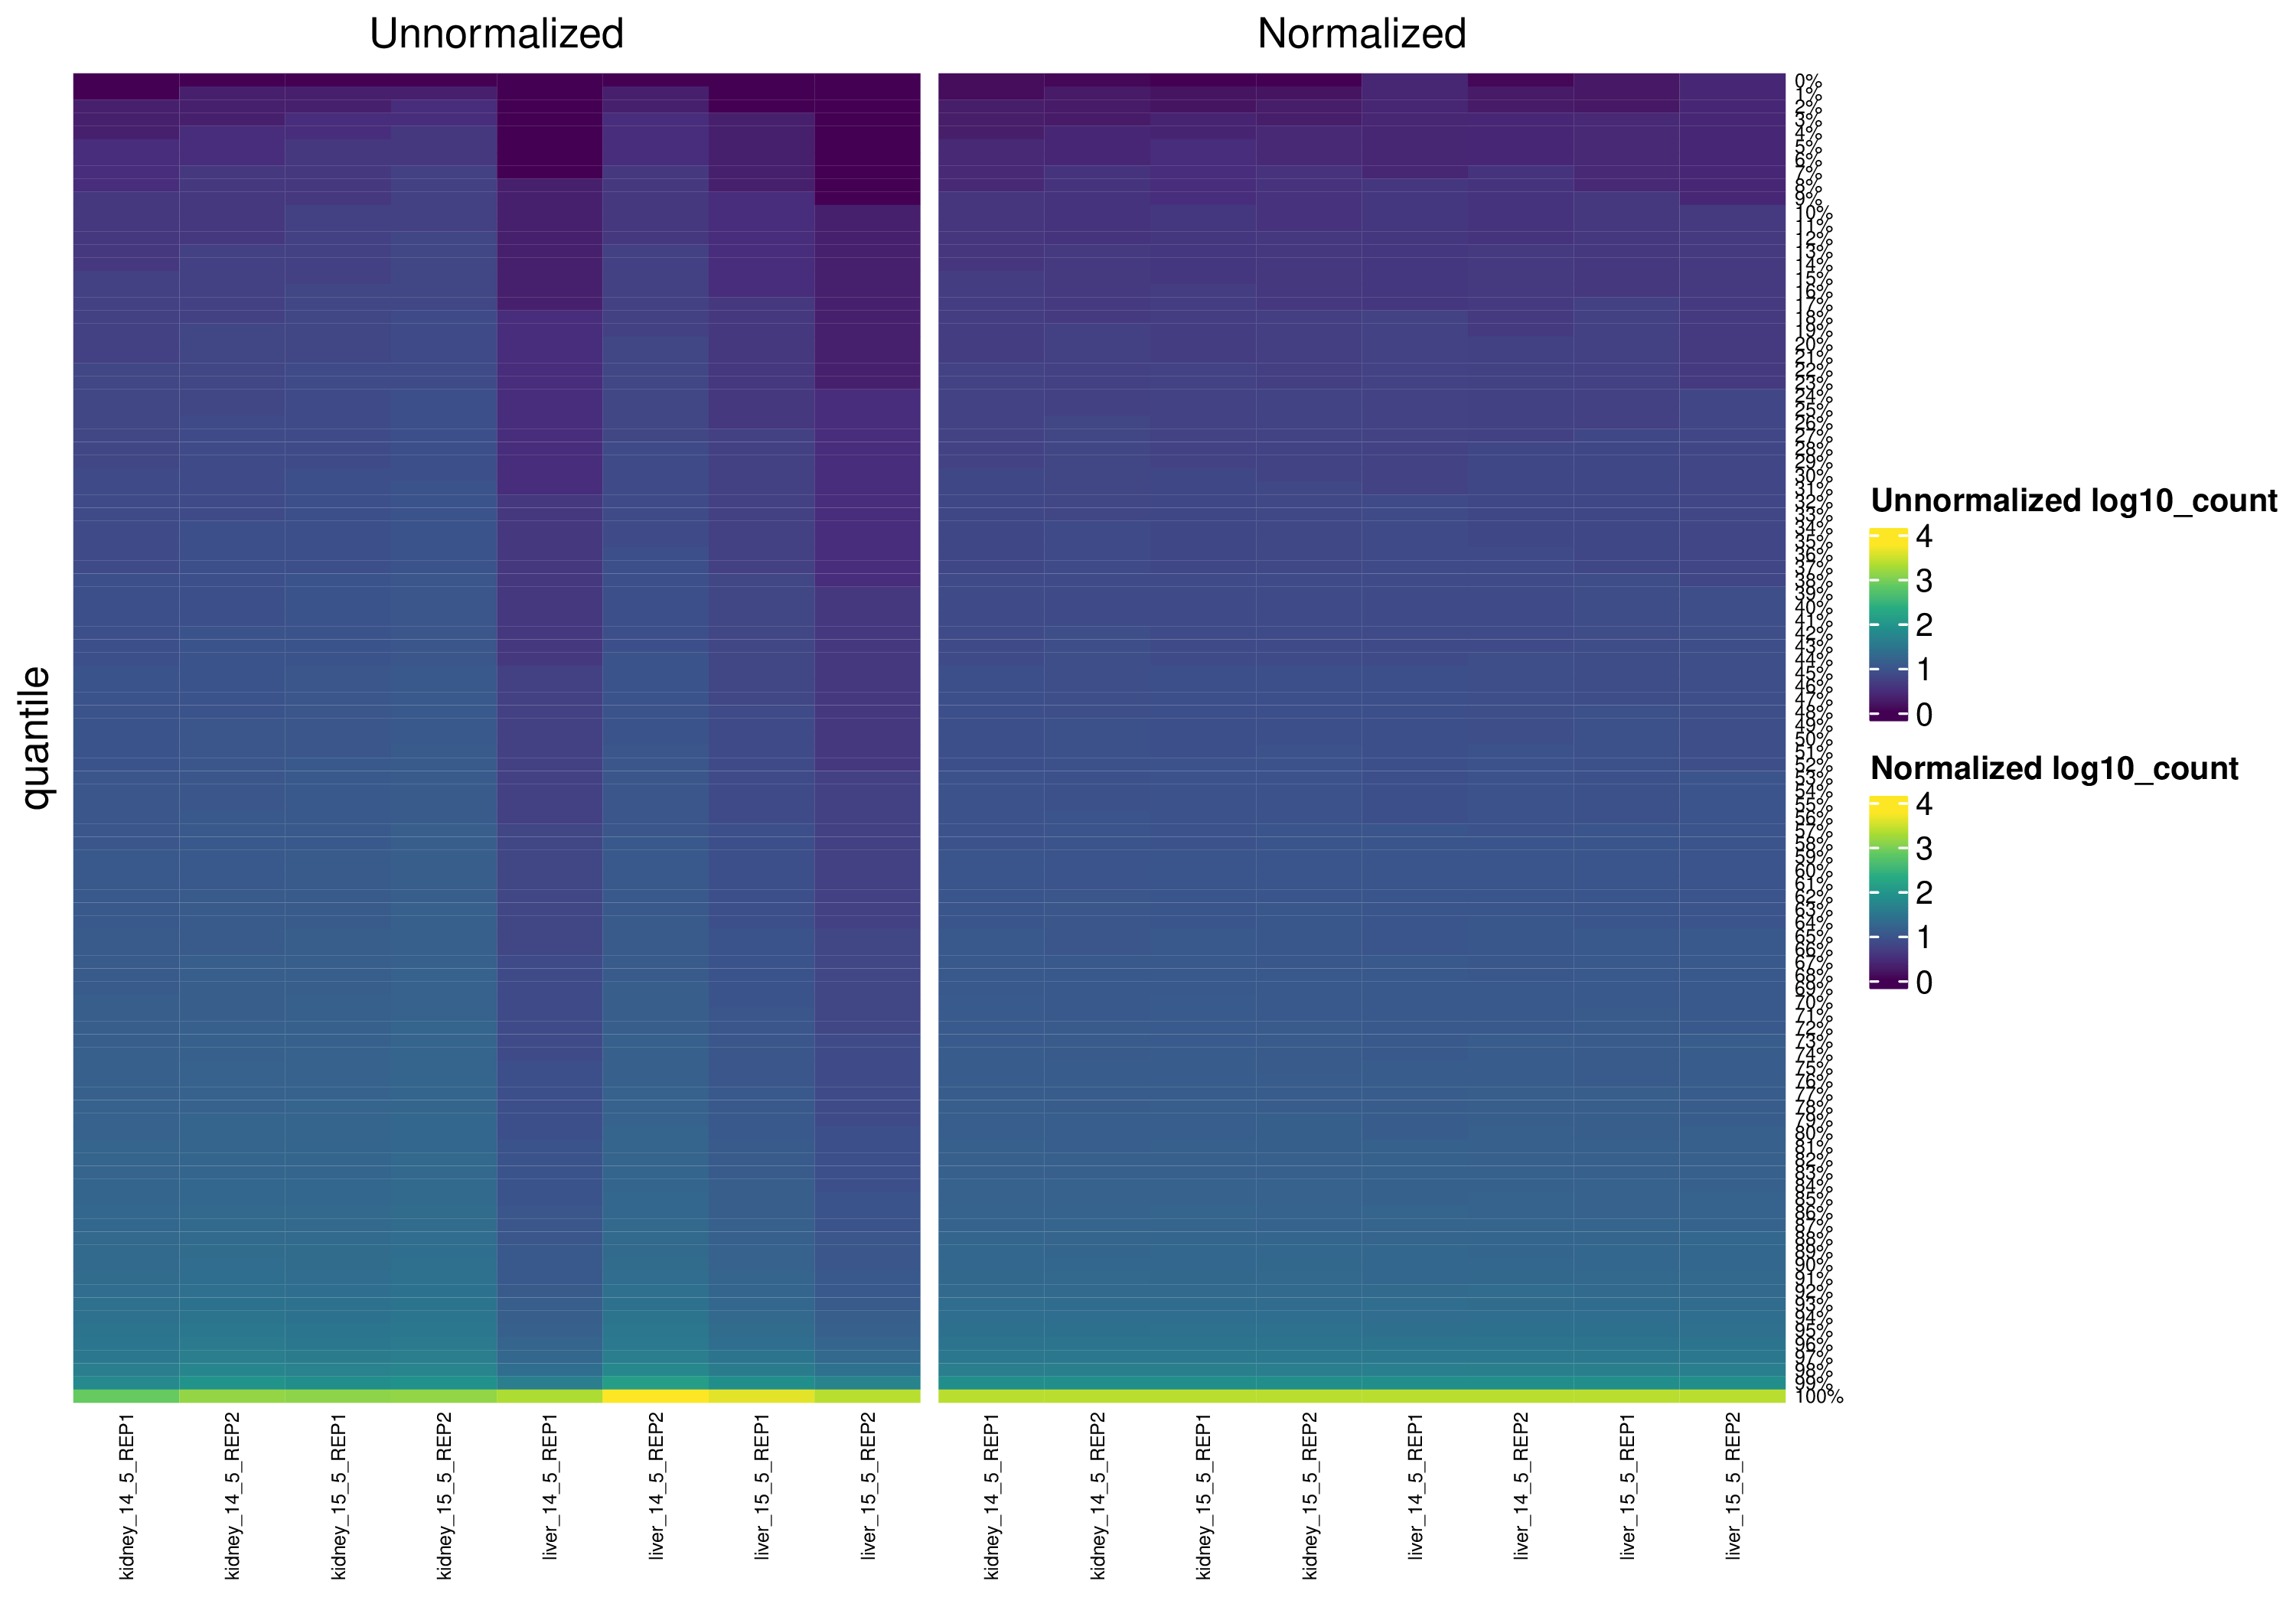
The heatmaps below show the unnormalized and normalized insertion counts at each quantile for each sample in the dataset.