Differential Accessibility


Comparisons

Differential Accessibility was quantified for the following comparisons:

Comparison name Annotation column Group 1 N1 Group 2 N2
1 kidney vs liver [tissue] tissue kidney 4 liver 4

Tables containing differential accessibility results can be found below.
tiling promoter consensusPeaks
kidney vs liver [tissue] not included (59 MB) TSV TSV
Comparison
Region type
Differential method

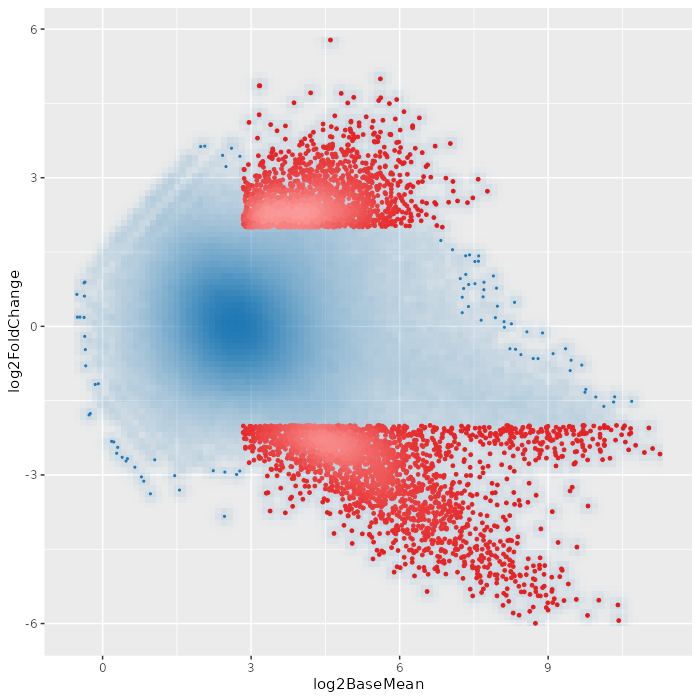
Figure 1

Open PDF Figure 1

MA plot

Differential motif activity

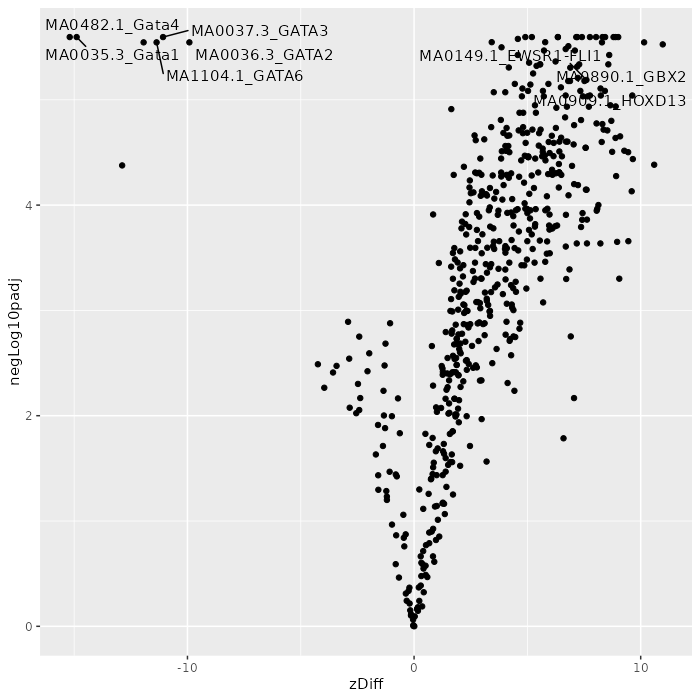
Differential chromVAR [1] motif activity was computed. The volcano plots below summarize the results.

Comparison
Region type

Figure 2

Open PDF Figure 2

Differential motif activity volcano plot

Tables summarizing differential chromVAR activity for all motifs can be found below.

tiling promoter consensusPeaks
kidney vs liver [tissue] not computed not computed TSV

References

  1. Schep, Wu, Buenrostro, & Greenleaf (2017). chromVAR: inferring transcription-factor-associated accessibility from single-cell epigenomic data. Nature Methods, 14(10), 975-978